For our members and network, we offer data visualization that simplifies research results and highlights patterns- so you are able to share your story in a way that is easy and quick to understand.
Data visualization can include historical timelines (history), environmental and ecological data, and more. This information can then be tied to location (mapping) and demographics – helping the audience make correlations and find trends.
For more information, contact our communications manager, Luma Kennedy, at luma@ncejn.org
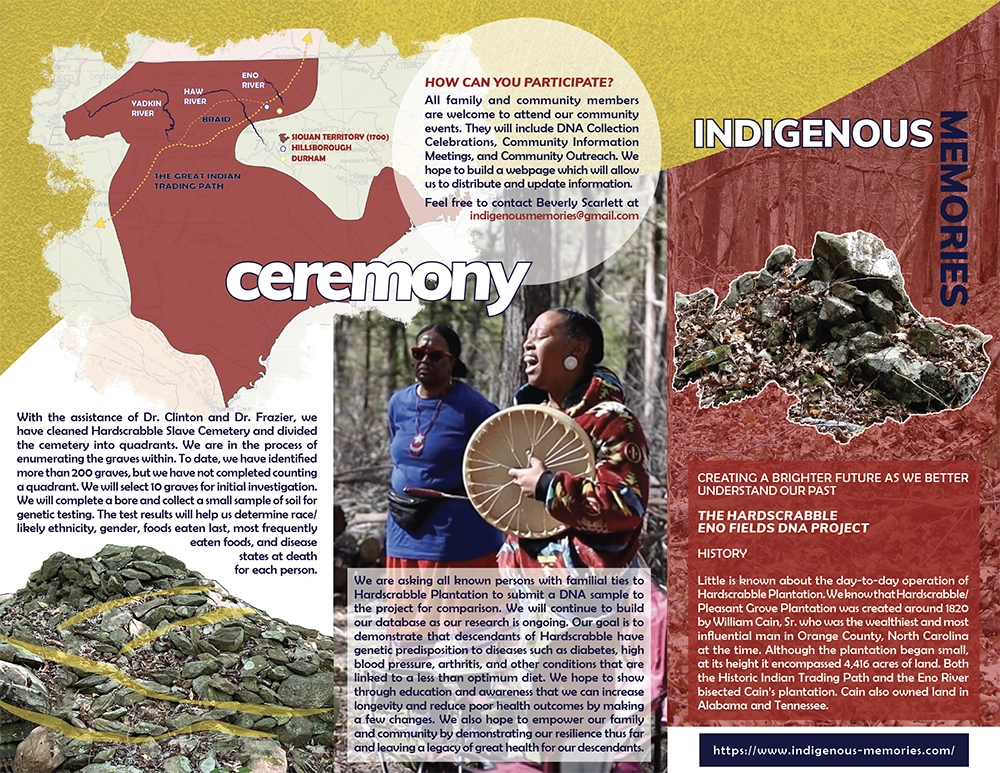
Here is an example of the work that has been produced in the past.